Figuring out your Total Addressable Market (TAM) is pretty straightforward on the surface: you just multiply the total number of potential customers by how much they'd spend with you each year. But getting to that number? That's where the real work begins.
There are three classic ways to tackle this: top-down analysis (starting big with industry data), bottom-up analysis (building up from individual customers), and value theory (estimating based on the tangible value your product creates).
What TAM Really Means for Your Business
Let's be clear: TAM isn't just some vanity metric for your pitch deck. It's the foundational number that puts a ceiling on your growth potential. It represents the entire revenue pie available for your product or service if you somehow captured 100% market share. Getting this right is the first step toward a believable business strategy.
A well-researched TAM calculation does way more than just get investors excited; it actively steers your company's direction.
- It Gets You Funded: Investors use TAM as a quick proxy for the size of the prize. A massive, clearly-defined market screams "high-upside venture."
- It Keeps Your Goals Realistic: Your TAM sets the ultimate boundary for your sales and marketing targets. It grounds your ambitions in what's actually possible.
- It Guides Your Roadmap: Knowing the market's total size helps you prioritize which features or new products will unlock the biggest revenue streams down the line.
The Three Core Calculation Frameworks
Each method for calculating TAM gives you a different lens to view your market. The key is to see them not as separate options, but as complementary approaches that can validate each other.
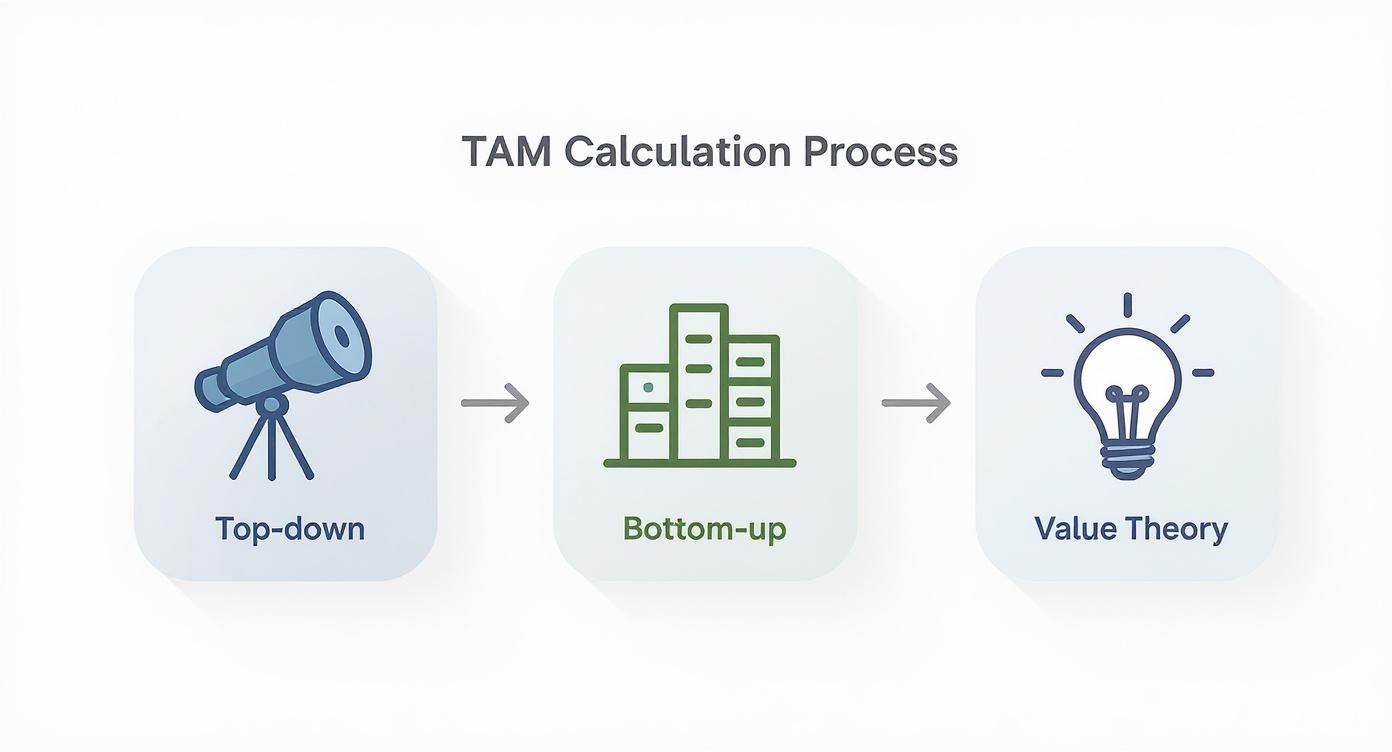
This gives you a good visual for how you can move from a broad, high-level estimate (Top-Down) to a highly specific, evidence-backed figure (Bottom-Up). And for brand-new markets where no data exists, Value Theory lets you build a case from scratch.
The most convincing TAM analyses I've seen always use at least two of these methods. One acts as a sanity check on the other, making your final number much harder to poke holes in.
Choosing the right method really depends on your industry, how mature your business is, and what kind of data you can actually get your hands on.
To make it easier to decide where to start, here's a quick rundown of each approach.
Quick Guide to TAM Calculation Methods
| Method | Approach | Best For | Primary Data Source |
|---|---|---|---|
| Top-Down | Starts with the total market size and narrows it down. | Quick estimates; mature industries with available reports. | Market research reports (Gartner, Forrester), government data. |
| Bottom-Up | Starts with individual segments and builds up to a total. | Niche markets; early-stage startups with a clear customer profile. | Your own sales data, industry directories, CRM data. |
| Value Theory | Calculates market size based on the value delivered to customers. | Disruptive tech; new products creating a completely new market. | Customer interviews, case studies, economic value models. |
Ultimately, the goal is to land on a number that's not just big, but believable. We'll dive into the nitty-gritty of each of these methods next.
Using the Top-Down Approach for a Fast Estimate

Sometimes you just need a number, and you need it fast. That's where the top-down approach comes in. It’s the quickest way to get a directional TAM estimate by starting with a massive, pre-existing market number and carving it down to your specific slice.
Think of it like this: you start with a satellite view of the entire country's economy and start zooming in, layer by layer, until you're looking at your specific neighborhood.
This method leans heavily on industry reports from big names like Gartner, Forrester, or government agencies. You're effectively borrowing their homework, their broad market analysis, and then applying your own filters to get to a number that makes sense for you. It's great for a back-of-the-napkin calculation, but its biggest flaw is that it's built on someone else's data and your own assumptions.
Finding and Filtering Market Data
Your first move is to hunt down a credible, high-level market size report. Let's say you're building a FinTech API that enriches company profiles. You might start with a report on the total global spend on business intelligence and data tools. That massive figure is your starting point.
From there, the real work begins. You have to start slicing away the parts of the market you don't actually serve. These filters are what turn an impossibly large number into something tangible.
You'll want to apply filters like:
- Geography: Are you only selling in North America and Europe? Cut out the rest.
- Company Size: Is your product really for tiny startups or massive enterprises? Be honest.
- Industry Vertical: Do you only focus on e-commerce, healthcare, or other SaaS businesses?
- Technology Stack: Does your API require customers to use specific platforms or languages?
Every filter you add shrinks the market size, but it also makes your TAM calculation much more realistic. This process of elimination is the heart of the top-down method.
A Practical Top-Down Example
Let's make this real. Imagine you run a company with a brand data API built for other software businesses. You dig up a report stating the global enterprise software market is worth a whopping $425 billion. Cool, but totally useless for you as-is.
So, you start filtering.
You know your API is really built for mid-sized businesses located in North America and Europe. Some quick research suggests this segment makes up about 25% of the global market. Boom. Your potential market just went from $425 billion to a more focused $106 billion. Still huge, but we're getting warmer. You can see more on this kind of market segmentation over on ZoomInfo's blog.
Next, you know your sweet spot is tech companies with 100 to 1,000 employees. If that group represents roughly 40% of the mid-sized segment, you can carve your TAM down again to about $42.4 billion. Each step makes the number more specific and defensible.
The top-down approach gives you a quick, ballpark figure that's great for initial conversations. However, always be prepared to defend your assumptions. An investor will absolutely ask why you chose 25% for your geographical focus or 40% for your company size segment.
While this approach gets you an answer in minutes, its reliance on broad, third-party data can easily lead to an overinflated number. That's why the smart move is to always pair it with a bottom-up analysis, it's the ultimate reality check.
Building a Credible Bottom-Up Calculation

While the top-down approach gives you a quick sense of scale, it's the bottom-up calculation that really holds up under scrutiny from investors. This method is all about building your market size from the ground up, starting with individual customer segments and your own real-world data.
It's definitely more work, but the result is a number that's both realistic and highly defensible. Instead of borrowing from broad industry reports, you’ll be using your own sales data, customer research, and specific market intelligence. This makes your TAM less of a guess and more of a concrete projection of your true potential.
Identifying Your Customer Universe
First things first: you need to nail down the exact number of potential customers you can serve. This requires getting granular with your ideal customer profile (ICP). We're not talking about a vague description here; you need a hard count.
Let's take a company like Brand.dev, which offers a developer API for brand assets. They would start by counting the total number of software companies that fit their target profile. This isn't just a simple search; it means drilling down into specific attributes like:
- Company Size: How many companies have between 20 and 500 employees?
- Industry: Which verticals get the most value from brand data? Think SaaS, FinTech, or AI.
- Tech Stack: How many prospects use frameworks compatible with their SDKs, like TypeScript or Python?
You can pull this data from sources like LinkedIn Sales Navigator, niche industry directories, or company data platforms. The goal is to create a definitive, countable list of all the companies that could realistically buy your product. If you need to dig deeper for insights on your specific customer, consider conducting primary market research.
Calculating Realistic Revenue Per Account
Once you know how many customers are out there, you need to figure out how much each one is actually worth. This is where your Average Revenue Per Account (ARPA) or Annual Contract Value (ACV) comes into play. It is absolutely critical to use a realistic figure based on your pricing model and early sales data.
If you already have paying customers, their average spend is your baseline. Simple. If you're still pre-revenue, look at what close competitors are charging or run surveys to gauge what potential customers are willing to pay. This step grounds your TAM in actual revenue potential, not just a list of potential logos.
The bottom-up method forces you to think like an operator, not just an analyst. You have to connect your market size directly to your pricing and sales strategy, which makes the final number far more meaningful for internal planning.
A SaaS company selling HR software is a perfect example. They identified roughly 20,000 small and medium-sized businesses in their target regions. By multiplying that number by their average ACV of £30,000, they landed on a credible TAM of £600 million.
This is exactly the kind of specific, data-driven calculation that makes the bottom-up approach so powerful.
Using Value Theory When No Market Exists

Top-down and bottom-up analyses are perfect when you're crashing an existing party, a known market with clear players. But what if you're throwing the party yourself? What happens when you're building something so new there's no market to analyze?
For genuinely disruptive products without direct competitors or historical data, you have to think differently. This is where the value theory approach shines.
Instead of counting existing customers or market reports, you calculate your TAM based on the tangible economic value your product creates for a user. From there, you figure out how much of that value you can realistically capture as revenue.
Quantifying the Value You Create
At its core, this method boils down to one question: How much cold, hard cash or valuable time does your product save your customers? This isn't about features; it's about selling a quantifiable improvement to their bottom line.
To get started, you have to put a dollar figure on the impact of your solution. This usually falls into a few buckets:
- Cost Savings: How much do you reduce their spending on labor, software subscriptions, or operational overhead?
- Revenue Generation: How much more money can a customer make because your product exists?
- Risk Reduction: What's the financial cost of a mistake or compliance breach that you help them avoid?
This perspective is an absolute must-have when you're breaking new ground. It's also a critical lens for understanding funding for your invention, as it helps investors see the potential where others see a blank slate.
From Perceived Value to Market Size
Once you've nailed down the value you deliver in dollar terms, the next step is to estimate what slice of that pie customers are actually willing to pay for.
A good rule of thumb is that companies will pay for roughly 10-20% of the total economic value they get back. This percentage is your North Star for setting a potential price point.
This approach is tailor-made for novel products. Think about the early days of ride-sharing. With no direct precedent, they couldn't just look up the "ride-sharing market size." Instead, they looked at the value they provided over the closest alternative: taxis. In 2010, the global taxi market was worth $100 billion. Uber's early pitch was that by offering superior convenience and experience, they could capture 20% of this adjacent market, giving them an initial TAM of $20 billion.
This method completely reframes the conversation with investors. It shifts from "How big is the market today?" to "How much value are we capable of creating?" It’s a powerful way to justify your vision when you're pioneering an entirely new category.
The final step is to multiply your projected price by the total number of potential customers who have the problem you solve. Even if the "market" doesn't exist, the need does. Find the number of businesses or people with that underlying pain point, and you've got a credible, value-driven TAM.
How to Stress-Test Your TAM Calculation
A TAM calculation is just a number on a slide until you prove it can take a punch. A single, unsupported figure won’t impress anyone who matters, especially investors. You need a defensible estimate, and the best way to get there is by attacking your own assumptions from every angle.
The fastest way to do this? Cross-reference your methods.
If you started with a top-down analysis, immediately run a bottom-up calculation. Do the numbers even live in the same zip code? A massive gap between the two is a blaring red flag. It means one of your core assumptions, either your market slice or your average revenue per account, is completely off base.
From Total Market to Realistic Targets
This is where your TAM gets real. A huge market is exciting, but it’s not a business plan. To bridge that gap, you need to bring your market size back down to earth with two crucial sub-segments.
These concepts are what separate a theoretical market from an actionable, near-term strategy.
- Serviceable Addressable Market (SAM): This is the slice of your TAM you can actually serve with your current product, sales model, and geographic footprint. If your TAM includes the entire globe but you only operate in North America, your SAM is limited to North American customers. Simple as that.
- Serviceable Obtainable Market (SOM): This is the piece of your SAM you can realistically win in the short term, usually over the next 1-3 years. Your SOM has to account for the messy reality of competition, your current brand awareness, and very real resource limitations.
Think of it like this: if TAM is the entire ocean, SAM is the part of the ocean your little boat can actually sail in, and SOM is the fish you plan to catch this year.
This framework shows investors you understand the critical difference between a long-term vision and near-term execution.
A well-defined SAM and SOM prove you're not just a dreamer with a big number. It shows you have a credible plan to capture a specific, winnable segment of the market first. That’s exactly what investors want to see.
Putting Your Assumptions to the Test
Comparing your top-down and bottom-up results is a great start, but you have to get out of the spreadsheet. It’s time to gather qualitative proof to back up your quantitative analysis.
A fantastic way to do this is through customer interviews.
Get on the phone with people in your target market. Show them your product or concept and ask bluntly, "Would you actually pay for this, and if so, how much?" Their gut-level reactions are invaluable for validating your pricing assumptions and true purchase intent.
Another powerful technique is running a small pilot program or a limited beta. Offer your product to a small group of users, even for free. If you can't get 100 people to try your product when it costs them nothing, it’s a brutal sign that your assumptions about the market’s “need” might be a fantasy.
This hands-on approach gives you real data on user engagement and willingness to adopt, making your SOM projection far more believable.
A Few Common Questions About Calculating TAM
Even with a solid framework, figuring out your market size is always part art, part science. It's totally normal for questions to come up. Here are some of the most common ones I hear, along with some straight-up answers.
What’s the Real Difference Between TAM, SAM, and SOM?
This one trips up everyone at some point, but it's pretty simple if you picture a set of nested circles. Each circle zooms in on a more realistic slice of the market.
-
TAM (Total Addressable Market): This is the big one. Think of it as the total global demand for a solution like yours. It’s the absolute maximum revenue you could dream of if you somehow captured every single potential customer on the planet.
-
SAM (Serviceable Addressable Market): This is the circle inside TAM. It's the part of the market you can actually reach with your current business model. If you only sell in North America, your SAM is just the North American customers, even if your TAM is worldwide. It's filtered by your geography, sales channels, and product capabilities.
-
SOM (Serviceable Obtainable Market): This is the smallest, most important circle. It's the piece of your SAM you can realistically win over the next 3-5 years. This number is grounded in reality, it accounts for your direct competitors, your team's resources, and the traction you have right now.
I like to think of it like this: TAM is the entire ocean. SAM is the specific area where you have a fishing license. And SOM is how many fish you can actually catch with your current boat and crew. An investor is going to focus on your SOM because it shows you have an actionable, near-term plan.
What Are the Most Common Ways People Mess Up Their TAM?
It's surprisingly easy to make a few mistakes that can make your whole analysis look amateur. By far, the biggest error is being way too optimistic. People just don't apply enough realistic filters, and they end up with a TAM that's astronomically, impossibly large.
Another classic mistake is using old data for a top-down analysis. A market report from five years ago is useless in a fast-moving space like FinTech or SaaS. You might as well be using a map from the 1800s.
Finally, the most critical mistake is not sanity-checking your work. If you only do a top-down calculation and don't bother building a bottom-up model to see if they're in the same universe, you’re just guessing. The two numbers don't need to match to the dollar, but they absolutely should be in the same ballpark.
How Often Should I Recalculate My TAM?
Your TAM isn't a "one-and-done" number you stick in a pitch deck and forget about. The market is always moving, and so should your understanding of it.
You should definitely plan on revisiting your TAM at least once a year, probably during your annual strategic planning. But certain events should make you drop everything and run the numbers again immediately.
These triggers include things like:
- A major product pivot where you suddenly start selling to a whole new type of customer.
- Expanding into new countries or regions.
- Big market shifts, like a new technology exploding onto the scene (think generative AI), major new regulations, or a scary, well-funded competitor showing up.
Keeping your TAM analysis fresh is the only way to make sure your strategy is based on what's actually happening in the market today, not last year.
Ready to enrich your own product with powerful brand data? Brand.dev provides a simple API to access logos, colors, fonts, and complete company profiles instantly. Join over 4,000 businesses using our data to build better, more personalized user experiences. Get your free API key.