At its core, analytics in advertising is all about using data to measure, manage, and sharpen the performance of your ad campaigns. It’s what turns marketing from a guessing game into a science, giving you clear insights into what actually resonates with your audience and, more importantly, what drives results.
Why Analytics in Advertising Is Your Competitive Edge
Think of it like this: one chef follows a precise recipe, measuring every ingredient and adjusting the temperature based on experience. Another just throws ingredients into a pot and hopes for the best. Which one is going to create a masterpiece consistently?
Modern advertising works the same way. Without analytics, you’re the chef guessing amounts and wasting good money on campaigns that fall flat. With analytics, you become the meticulous chef, making calculated decisions that turn every dollar spent into a strategic investment.
From Guesswork to Growth
Analytics gives you the roadmap to navigate the complex path to your customers. It's the difference between blindly launching campaigns into the void and strategically guiding them toward success. This data-driven approach lets you:
- Understand Customer Behavior: Find out which ad copy, visuals, and platforms actually grab your audience's attention.
- Optimize Ad Spend: Funnel your budget into the channels and campaigns delivering the highest return, cutting the dead weight from underperforming ads.
- Prove Campaign Value: Show stakeholders clear, data-backed evidence of how your marketing efforts directly impact business goals.
The industry is leaning into this hard. The Ad Analytics market is projected to rocket from USD 6.04 billion in 2025 to USD 20.33 billion by 2035, a clear signal of a massive shift toward data-centric strategies. You can read more about this market growth trend and its implications.
By embracing analytics, you stop asking, "Did my ads work?" and start answering, "How can I make my ads work even better?"
This shift, from hoping for results to engineering them, is the foundation of high-performance marketing. It empowers teams to learn, adapt, and consistently improve, securing a major competitive advantage. This guide will walk you through the essential components you need to build your own data-driven advertising engine.
Decoding the Metrics That Actually Matter
Stepping into your advertising dashboard can feel like staring at the controls of a spaceship, a dizzying sea of acronyms and numbers. It's tempting to track everything, but the real pros know that success comes from focusing on the metrics that actually signal business growth.
Think of it like a pilot's cockpit. The altimeter and airspeed indicator are non-negotiable. The cabin temperature? Nice to know, but not critical for landing the plane. The key to smart analytics in advertising is knowing which gauges to watch. We can break these down into a few key groups that follow a customer's journey, from their first impression to becoming a loyal fan.
Building Brand Awareness
This is the top of your funnel, the very beginning of the relationship. Here, you're measuring how well your ads grab attention and introduce your brand to people who've never heard of you. It's all about being seen.
- Impressions: This is simply the total number of times your ad was displayed on a screen. It doesn't mean it was actually seen or clicked, just that it was served. Think of it as the raw firepower of your campaign.
- Reach: This counts the unique number of people who saw your ad at least once. Reach tells you the size of your audience, while impressions tell you how often you hit them. If your reach is 1,000 and your impressions are 3,000, it means each person saw the ad an average of three times.
These two are your go-to metrics for brand campaigns where the main goal is just getting your name out there. They tell you if your message is spreading, but not if it’s sticking. For that, we need engagement.
Measuring Audience Engagement
Engagement metrics are the bridge between seeing and acting. They’re a sign that your ad was interesting enough to make someone stop scrolling and interact, which is a huge signal of genuine interest.
- Click-Through Rate (CTR): Calculated as (Clicks ÷ Impressions) x 100, CTR tells you what percentage of people who saw your ad actually clicked on it. A high CTR is a great sign that your creative and targeting are aligned.
- Engagement Rate: This is a broader measure that bundles in clicks, likes, comments, shares, and video views. It gives you a much richer picture of how people are interacting, especially on social media where a click isn't the only goal.
A solid CTR is a good start, but it's only half the story. A click that goes nowhere is just a hole in your pocket.
Tracking Conversion and Profitability
This is where the rubber meets the road. These are the metrics that connect your ad spend directly to your bottom line, proving whether your campaigns are actually making you money.
The ultimate goal of most advertising is not just to be seen, but to drive action. Conversion and profitability metrics are the final verdict on your campaign's financial success.
Here's a quick look at the most common metrics advertisers live and die by.
Essential Advertising Metrics and What They Tell You
This table breaks down the metrics you'll encounter most, what they measure, and why they matter for making smart decisions.
| Metric Category | Key Metrics | What It Measures |
|---|---|---|
| Awareness | Impressions, Reach, Frequency | How many people are seeing your ads and how often. Essential for brand-building campaigns. |
| Engagement | Click-Through Rate (CTR), Engagement Rate | How compelling your ad creative and messaging are. Shows if you're capturing audience interest. |
| Conversion | Conversion Rate, Cost Per Acquisition (CPA) | How effectively your ads turn clicks into customers. Directly measures campaign efficiency. |
| Profitability | Return on Ad Spend (ROAS), Customer Lifetime Value (LTV) | The financial return on your investment. The ultimate test of whether your advertising is profitable. |
| Platform-Specific | View-Through Conversions (VTC), Cost Per Mille (CPM) | Nuanced metrics that reveal ad impact beyond a direct click, like on video or display networks. |
By keeping a close eye on these numbers, you can move from just spending money to strategically investing it.
Here are the critical numbers that define your campaign’s bottom line:
- Conversion Rate: This is the percentage of people who clicked your ad and then completed a specific goal, like making a purchase or signing up. A high CTR with a low conversion rate often points to a mismatch between what your ad promises and what your landing page delivers.
- Cost Per Acquisition (CPA): This is your total ad spend divided by the number of conversions. It tells you exactly how much you're paying to get one new customer from a specific campaign.
- Return on Ad Spend (ROAS): Calculated as (Revenue from Ads ÷ Ad Spend), ROAS is the king of profitability metrics. A ROAS of 4:1 means you're generating $4 in revenue for every $1 you spend on ads.
These metrics are how you justify your budget. To truly get a handle on performance, you have to look past the vanity numbers. For a deeper look into this, an article on understanding what metrics really matter and how AI can surface them offers some fantastic insights.
Understanding Long-Term Customer Value
Focusing only on immediate ROAS can be a trap. The most valuable customers aren't the ones who buy once; they're the ones who come back again and again. That's where Customer Lifetime Value (LTV) comes in.
LTV is the total revenue you can expect from a single customer over the entire course of their relationship with you. Knowing this number completely changes how you think about your CPA. A $100 CPA might seem insane for a $50 first purchase. But if you know that customer's LTV is $600, that $100 acquisition cost suddenly looks like a brilliant investment.
When you connect LTV to your advertising analytics, you start making smarter, more sustainable decisions about who you're targeting and how much you're willing to pay to win them over.
Connecting the Dots with Attribution Modeling
Customers almost never see one ad and immediately buy something. Their path is more like a winding road with multiple stops, a social media ad here, a Google search there, maybe an email newsletter, and finally a retargeting banner that seals the deal. This journey creates a huge question for marketers: which one of those stops gets the credit for the sale?
That's the attribution puzzle.
Think of it like a game-winning goal in soccer. Does the striker who kicked the ball into the net get 100% of the credit? What about the midfielder who passed it perfectly, or the defender who started the whole play from the backfield? Attribution modeling is how marketers answer that same question, assigning value to every marketing channel that had a hand in a conversion. It’s a core part of analytics in advertising that helps turn a messy customer journey into a clear story.
To really connect the dots, you need to get familiar with the different models. There's a great strategic guide on understanding attribution modeling that shows how these concepts apply in the real world.
Simple Models: Single Touchpoint Stories
The easiest way to start is with single-touch models. They’re straightforward to set up and understand, but they usually don't tell the whole story.
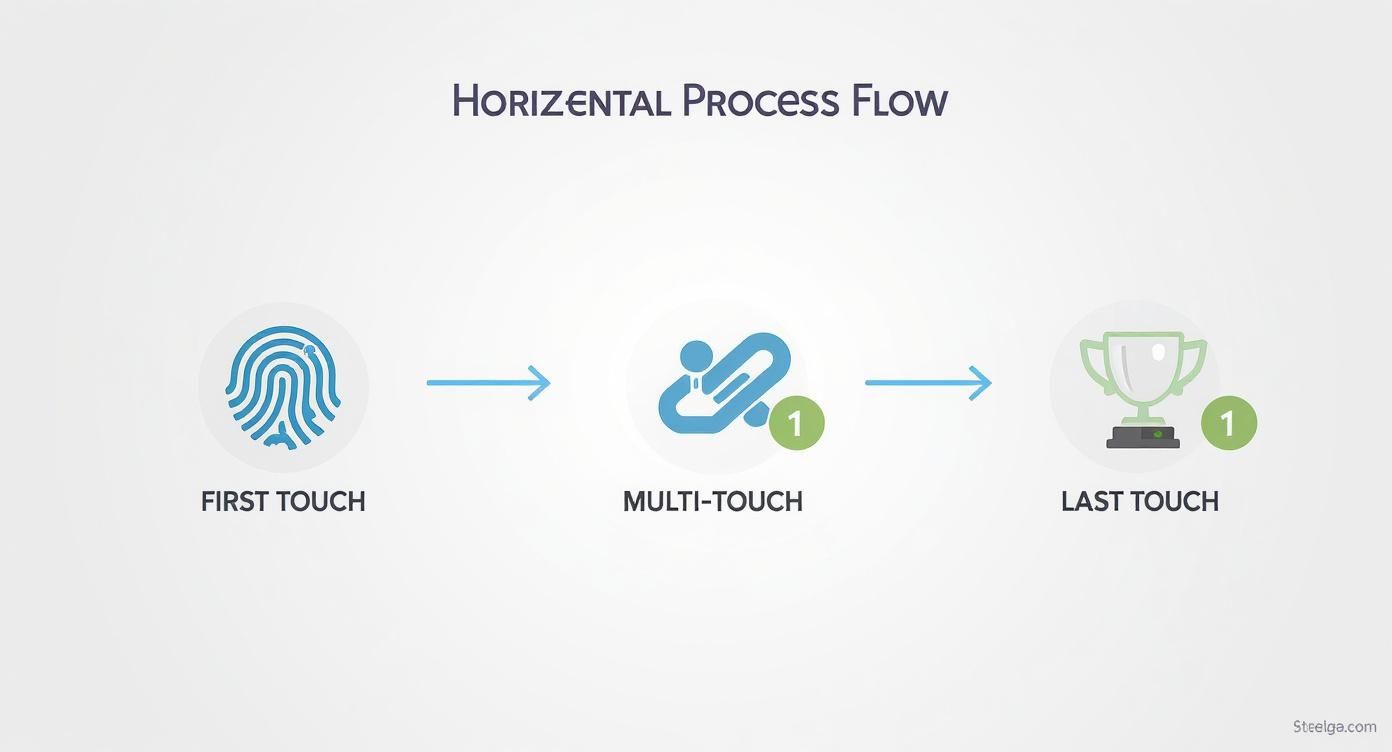
- First-Touch Attribution: This model gives all the credit to the very first interaction a customer had with your brand. In our soccer analogy, this is like giving all the glory to the defender who first kicked the ball upfield. It's great for figuring out which channels kickstart awareness, but it ignores everything that happens after that initial touch.
- Last-Touch Attribution: As the most common (and often default) model, this one gives 100% of the credit to the final touchpoint right before the conversion. This is the striker who scored the goal. It's simple, but it completely overlooks all the other channels that nurtured the customer along the way, often giving too much credit to channels like branded search.
Relying on these models is like looking at a single frame of a movie instead of watching the whole film. You get a snapshot, but you miss all the character development.
Advanced Models: The Full Journey
Multi-touch attribution models try to spread the credit more fairly across all the touchpoints, giving you a much more balanced view of how your marketing is really working.
Attribution isn't about finding one magic channel. It’s about understanding how your channels work together as a team to guide a customer from awareness to action.
- Linear Attribution: This model is the ultimate team player. It splits the credit equally among every single touchpoint in the journey. If a customer saw four ads before buying, each ad gets 25% of the credit. It’s fair, but it doesn't recognize that some interactions might be more influential than others.
- Time-Decay Attribution: Here, the touchpoints that happened closer to the sale get more credit. The midfielder’s assist gets more credit than the defender’s initial kick. This model works well for businesses with shorter sales cycles, where the most recent interactions matter most.
- Position-Based (U-Shaped) Attribution: This is a hybrid model that gives 40% of the credit to the first touch and 40% to the last touch, then divides the remaining 20% among all the interactions in between. It rightly values both the channel that introduced the customer and the one that closed the deal.
Picking the right model really depends on your business goals and how your customers buy. And as data becomes more critical, the tools to analyze it are getting better and more necessary. In fact, the marketing analytics market is projected to grow from USD 6.2 billion in 2025 to over USD 11.5 billion by 2029.
This push toward smarter attribution is all about getting a clearer picture, especially as privacy changes shake up how we collect data. For more on that, you might want to check out our guide on the shift away from third-party data and what it means for marketers.
Building Your Advertising Data Engine
Great analytics in advertising doesn't just happen, it's built on a solid technical foundation. Think of this system, often called a data stack, as the central nervous system for your marketing. It’s where you collect all the raw signals from dozens of sources and transform them into something your team can actually use to make smarter decisions.
We can break down building this engine into four stages, a lot like setting up a professional kitchen. You gather raw ingredients, prep them, store them properly, and finally, present the finished dish. Each step is critical for turning isolated data points, like clicks and impressions, into a coherent strategy. Skip a step, and you’re left with a messy pile of data and no real insight.
Gathering Your Raw Ingredients
First things first, you need to collect data from all your sources. These are the fresh ingredients for your analysis, and they come from all over the place, each telling a small part of your customer's story.
Your main sources will probably include:
- Ad Platforms: Think Google Ads, Meta Ads, and LinkedIn Ads. This is where you get your core performance data, impressions, clicks, cost, and platform-reported conversions.
- CRM Systems: Tools like Salesforce or HubSpot hold the ground truth about your customers, including lead status, deal size, and lifetime value.
- Web Analytics Tools: This is where you track what people do on your website. For a deeper dive, our guide on how to track visits to a website is a great place to start.
- Product Analytics: If you’re a SaaS company, this is your goldmine. Data from tools like Mixpanel or Amplitude tells you about user engagement, feature adoption, and churn rates.
Each source provides a different piece of the puzzle. The real magic happens when you bring them all together to see the full picture.
Preparing and Storing Your Data
Once you have your ingredients, you can't just toss them into a pan. They need to be cleaned, chopped, and organized first. This is where data integration and warehousing come into play.
Data integration tools are your prep cooks. They use processes like ETL (Extract, Transform, Load) to pull data from all your sources, clean it up for consistency (like standardizing campaign names across platforms), and load it into one central place. This step is what makes it possible to blend data from different systems.
That central place is your data warehouse, think of it as a massive, perfectly organized pantry. It’s a specialized database built to store huge amounts of historical data from every corner of your business. We're talking about platforms like Google BigQuery, Amazon Redshift, or Snowflake. Getting all your data into one of these is the key to unlocking the kind of deep, complex analysis you could never do in siloed dashboards.
Your data warehouse becomes the single source of truth for the entire organization. It ends the debates over whose numbers are "right" and gets everyone working from the same, unified dataset.
This centralized setup is what gives your reporting consistency and reliability. For example, once you have all your touchpoints in one place, you can run different attribution models to see how credit for a conversion gets assigned, as the infographic below shows.
This is why having a unified view is so important, it lets you see the whole journey and analyze it from different angles.
Presenting the Finished Meal
Finally, with all your data prepped and stored, it's time for presentation. This is where data visualization tools step in, acting as the master chefs who plate the final dish.
Platforms like Tableau, Looker, or Google Data Studio connect directly to your data warehouse. They turn endless rows of numbers into intuitive dashboards, charts, and graphs. This makes it easy for anyone on your team, not just the data scientists, to understand campaign performance, spot trends, and find actionable insights. This final step is what turns complex data into a clear story that drives better advertising.
Moving Beyond Clicks to Creative Insights

Metrics like CPA and ROAS are great for telling you if your campaigns are making money. What they don't tell you is why they’re working. The most powerful analytics in advertising digs deeper, moving past performance data to decode the specific creative choices that actually connect with your audience.
It’s about understanding the story behind the numbers. Instead of just looking at the bottom line, we start asking better questions. Is it the bold, high-contrast image or the softer, lifestyle photo that drives more engagement? Does a direct, benefit-focused headline outperform a clever one? This is how you turn creative work from a subjective art into a measurable science.
The digital ad market is exploding, on track to hit USD 843 billion in 2025. Mobile is the biggest piece of that pie, projected to make up 70% of total ad spend by 2028. As the space gets more crowded and expensive, knowing which creative levers to pull is no longer a luxury, it's how you survive. You can get a closer look at these numbers and discover more insights about digital marketing statistics on hostinger.com.
Unpacking Your Creative Performance
To get started, you need a system for analyzing the individual pieces of your ads. This means tagging and categorizing every creative asset based on its specific attributes.
Think of it like breaking down a recipe. You don’t just know a dish was good; you know it was the pinch of smoked paprika or the fresh basil that made it work. The same goes for your ads. You need to track elements like:
- Visual Style: Tag images as "product-focused," "lifestyle," "user-generated content," or "animation."
- Copy Tone: Classify headlines and body text as "inspirational," "urgent," "humorous," or "educational."
- Video Length: Segment video ads into buckets like "under 15 seconds," "15-30 seconds," and "over 30 seconds."
- Call to Action (CTA): Note the exact phrasing, like "Shop Now," "Learn More," or "Get a Free Demo."
Once you have this data organized, you can start slicing your performance reports in new ways. You might discover that for one audience, lifestyle imagery with an educational tone drives the lowest CPA. For another, it might be urgent copy paired with product-focused visuals. These are the insights that give you a real competitive edge.
Integrating Brand Metrics for a Fuller Picture
Performance data tells you what people did, but brand data tells you how they feel. Adding brand metrics into the mix provides crucial context, helping you see the long-term impact of your advertising beyond immediate conversions.
Analytics isn't just about counting clicks. It's about understanding the subtle signals your audience sends about what they value, what captures their attention, and what builds trust in your brand.
Here are a couple of key brand metrics to fold into your analysis:
- Brand Sentiment Analysis: Use social listening tools to monitor whether mentions of your brand are positive, negative, or neutral. A campaign might have a fantastic CPA, but if it generates negative buzz, it could be quietly damaging your brand equity.
- Share of Voice (SOV): This metric tracks your brand's visibility compared to your competitors. A truly successful campaign should not only drive conversions but also boost your presence and relevance in the market.
Connecting these qualitative insights with your quantitative data gives you a much richer, more complete view of performance. For example, enriching your CRM with brand information allows for much smarter segmentation and personalization. If you're looking for ways to get started, our guide on B2B data enrichment strategies offers some practical next steps.
Putting Creative Analytics into Practice
The best way to get definitive answers about what works is through structured, disciplined testing. Your go-to tool here is the classic A/B test. Isolate one variable at a time, the headline, the main image, the CTA button, and run two versions of the ad to see which one performs better.
Start small. Test big, bold ideas first. Think completely different value propositions or a new visual style before you start tweaking button colors. This methodical approach ensures you're constantly learning and iterating, using real-world data to refine your creative strategy and drive better results.
Putting Your Analytics into Action
Collecting data is just the starting line. The real money in advertising analytics is made when you turn those insights into action. Data sitting on a dashboard is pure potential, nothing more. To unlock it, you need a clear playbook that connects what you know to what you do.
This whole process begins with laying a solid foundation, a set of principles and processes that everyone from marketing to product can get behind. Think of it as installing the operating system for your data-driven ad efforts.
Establish a Single Source of Truth
The fastest way to kill a data strategy? Argue about whose numbers are right. When the marketing team’s spreadsheet doesn’t line up with the sales team’s CRM, you burn precious time debating data integrity instead of making decisions. That’s why a single source of truth (SSoT) is non-negotiable.
Your data warehouse, which should pull together data from all your ad platforms, web analytics, and your CRM, needs to be that definitive source. When everyone is working from the same unified dataset, the conversation shifts from "Is this number right?" to "What does this number mean for the business?" This alignment is what lets you move fast and with confidence.
Set Clear KPIs Before You Start
Never, ever launch a campaign without knowing what winning looks like. Before a single dollar gets spent, your team has to agree on the key performance indicators (KPIs) that actually matter. Are you gunning for direct sales (ROAS), qualified leads (CPA), or just getting your name out there (Reach and Engagement)?
Nailing this down upfront accomplishes two critical things:
- It keeps you focused. Every ad creative, every targeting choice, every budget decision gets made with a clear goal in mind.
- It makes reporting dead simple. You can tell at a glance if a campaign is hitting its mark, without getting distracted by vanity metrics.
Foster a Culture of Continuous Testing
The teams that consistently win don't treat advertising as a series of one-off projects. They see it as a continuous cycle of learning and getting better. This means building a culture where testing isn't an occasional event, it's just how you operate.
Data doesn't give you absolute answers; it gives you better questions. A culture of experimentation is what turns those questions into measurable growth.
Get your team in the habit of constantly forming hypotheses and running structured tests to see if they're right. For example: "We bet a video ad showing customer testimonials will drive a lower CPA than our current static image ad." Then, you run a clean A/B test, measure the results against your main KPI, and roll out the winner. It's this iterative loop that turns small, consistent improvements into massive long-term gains.
How Creative Analytics Drives Real Conversions
Let's make this tangible. A B2B SaaS company was running LinkedIn ads to get demo requests, but their cost per acquisition was way too high. The performance data showed they were getting plenty of clicks, but people weren't converting once they hit the landing page.
Instead of just fiddling with bids and budgets, they dug into their creative analytics. By tagging the different components of their ads, they spotted a pattern: ads featuring a screenshot of their product's dashboard had a 15% higher CTR than ads using generic lifestyle photos. The problem? Their landing page didn't reflect what was working in the ad.
Armed with this insight, they ran a simple test. They created a new version of the landing page that put the same dashboard screenshot front and center, creating a seamless visual journey from ad to page. The result was a massive win, their conversion rate on that page shot up by over 30%, bringing their CPA comfortably into their target range. It's a perfect example of how connecting creative data to a disciplined testing process turns insights into real business impact.
Common Questions About Advertising Analytics
Even when you've got the basics down, you'll inevitably run into a few head-scratchers when you start putting advertising analytics into practice. Let's tackle some of the most common questions that pop up in the real world.
How Can Small Businesses Start with Advertising Analytics?
You don’t need a six-figure tech stack to get going. The smartest move is to start with the powerful, free tools you probably already have access to.
First, get really good at using the built-in analytics inside platforms like Google Ads and Meta Ads. Their dashboards give you the core vitals, clicks, cost, and conversions, right out of the box. Then, make sure Google Analytics is set up correctly on your site to see what people actually do after they click your ad.
Pick one main goal to track, like online sales or lead form sign-ups. This lets you calculate the one metric that truly matters in the beginning: Return on Ad Spend (ROAS). Once you nail these fundamentals, you’ll have a solid foundation to build on, and you can add more sophisticated tools as your business grows.
What Is the Difference Between Ad Analytics and Web Analytics?
Think of it like throwing a party. Ad analytics is all about how well your invitations worked. Web analytics tells you what happened once your guests arrived.
-
Ad Analytics: This is your invitation's scorecard. It tracks metrics like impressions, clicks, and cost per click (CPC), telling you how effective your campaigns are at getting people to your website. It answers the question, "Did my ad get them to the front door?"
-
Web Analytics: This is what happens inside the party. It follows what visitors do on your site, which pages they visit, how long they stick around, and whether they fill out a form or make a purchase. It answers the question, "Is my website good enough to make them stay and have a good time?"
You need both to see the full picture, from the first ad impression all the way to a happy customer.
How Do I Prepare for a Cookieless Future?
The end of third-party cookies isn't just a technical problem; it's a strategic shift. You have to move from tracking anonymous users to building real relationships with your audience.
The cookieless future isn't about finding a new way to spy on people. It's about earning the right to use the data customers give you directly and finding privacy-friendly ways to measure what works.
To get ready, you need to focus on three key areas:
- Embrace First-Party Data: This is your new gold standard. Actively collect data from your audience through email sign-ups, customer accounts, and gated content. This data is not only more accurate, but it also gives you a direct line to your customers.
- Set Up Server-Side Tracking: Start using the Conversion APIs from platforms like Meta and Google. This sends data from your server directly to the ad platform, creating a much more durable and reliable link than old-school browser cookies.
- Explore New Measurement Tech: It's time to start learning about the next wave of analytics tools. Look into things like data clean rooms, which let you analyze aggregated data without ever exposing an individual's information. Getting familiar with these now will put you way ahead of the curve.
Ready to enrich your product and marketing with accurate, real-time brand data? Brand.dev provides a powerful API to instantly access logos, colors, and complete company profiles, helping you create personalized experiences that drive engagement. Get your free API key and start building today.