Let's be honest, marketing used to feel a bit like guesswork. You'd launch a campaign, cross your fingers, and hope for the best. Marketing analytics is what changes all of that. It's the practice of measuring, managing, and analyzing your marketing performance to see what's actually working.
Instead of relying on gut feelings, you start making data-driven decisions to make smarter marketing choices.
Understanding the Core of Marketing Analytics

Think of marketing analytics as the GPS for your strategy. It shows you where you are right now, helps you pinpoint where you want to go, and then maps out the most efficient route to get there. Without it, you're essentially driving blind. With it, every move you make is informed and purposeful.
The main goal here is simple: stop guessing which campaigns are resonating and start knowing. By collecting and digging into the data, you can uncover powerful insights about your audience, campaign performance, and, most importantly, your return on investment (ROI). This isn't just a "nice-to-have" anymore; it's a fundamental requirement for growth.
The market reflects this shift. Valued at $5.35 billion in 2024, the marketing analytics space is on track to hit $11.53 billion by 2029. That's a massive jump, and it shows just how critical this has become for businesses of all sizes.
Marketing analytics transforms abstract goals into measurable outcomes. It’s the bridge between what you think is working and what you can definitively prove is driving results for your business.
To give you a quick overview, here are the foundational pillars of marketing analytics.
Marketing Analytics at a Glance
| Component | Description |
|---|---|
| Data Collection | Gathering raw information from various sources like your website, social media, CRM, and ad platforms. |
| Data Measurement | Quantifying marketing activities using Key Performance Indicators (KPIs) like conversion rates or CPL. |
| Data Analysis | Interpreting the data to find patterns, trends, and actionable insights that inform your strategy. |
| Reporting & Visualization | Presenting your findings in an easy-to-understand format through dashboards and reports. |
| Attribution | Assigning credit to the different marketing touchpoints that led to a conversion. |
| Optimization | Using insights from your analysis to improve future campaigns and maximize ROI. |
Each of these components plays a crucial role in building a complete picture of your marketing performance.
Why It Matters for Modern Marketers
Putting a solid analytics strategy in place lets you do so much more than just look backward. It empowers you to become predictive and proactive. A key piece of this puzzle is being able to understand attribution modeling, which helps you see exactly how different touchpoints work together to bring a customer across the finish line.
Ultimately, marketing analytics helps you achieve three critical things:
- Optimize Spending: You can finally allocate your budget to the channels and campaigns that actually deliver results, cutting out the waste.
- Improve Customer Experience: By understanding user behavior, you can create more relevant, personalized journeys that your audience will love.
- Demonstrate Value: No more vague updates for stakeholders. You can justify your team's efforts with hard data that ties marketing activities directly to revenue.
The Four Types of Marketing Analytics
To get any real value from your data, you have to ask the right questions. Marketing analytics gives you a framework for this, breaking the process down into four distinct types. Each one builds on the last, taking you on a journey from simple reporting to true strategic foresight.
Think of it like leveling up from a historian of your own data to its fortune-teller. You start by looking at what’s already happened, then figure out why, predict what comes next, and finally, take action to shape that future.
1. Descriptive Analytics: What Happened?
This is the bedrock of all marketing analytics. Descriptive analytics is all about summarizing past data to tell you exactly what happened. It’s the most common type of analysis you’ll see and includes the usual suspects: website traffic reports, social media engagement summaries, and last quarter's sales figures.
For instance, a descriptive report might tell you:
- Your website got 10,000 visitors last month.
- The last email campaign had a 22% open rate.
- Organic search was your top traffic source, driving 40% of all sessions.
While this stuff is absolutely essential, it doesn't explain why any of it happened. It just lays out the facts, setting the stage for you to dig deeper.
Descriptive analytics is your marketing dashboard's rear-view mirror. It gives you a clear, factual summary of past performance, the necessary first step before you can diagnose problems or plan for the future.
2. Diagnostic Analytics: Why Did It Happen?
Okay, so you know what happened. The next logical question is... why? This is where diagnostic analytics steps in. It’s all about digging into your data to find the root causes behind the trends and numbers you saw in the descriptive phase.
This usually involves comparing a few data sets to connect the dots. Let's say website traffic spiked. You might check that against your campaign calendar and realize you launched a killer ad campaign that same day. Or if sales dipped, you might find a link to a wave of negative chatter on social media. Simple correlation, powerful insight.
3. Predictive Analytics: What Will Likely Happen?
Now we’re moving beyond the past and present. Predictive analytics uses your historical data, statistical models, and a bit of machine learning to forecast what is likely to happen next. This is where analytics starts to feel like a strategic superpower.
Companies use this to pinpoint customers who are about to churn, forecast sales trends for the next quarter, or estimate the ROI of a campaign that hasn't even launched yet. For a SaaS business, this could mean predicting which free trial users are most likely to convert to a paid plan based on how they're using the product.
4. Prescriptive Analytics: What Should You Do About It?
Finally, we have the most advanced stage. Prescriptive analytics takes forecasting one giant leap further by recommending specific actions you should take to get the outcome you want. This is where AI and machine learning really shine.
So instead of just predicting that a group of customers is likely to churn, prescriptive analytics might suggest the perfect discount to offer them and the best channel to send it through. It shifts you from just having insights to making automated, data-backed decisions, helping you make the best possible choice with confidence.
Key Marketing Metrics You Need to Track
Having access to data is one thing; knowing what to measure is a whole different ball game. That's where Key Performance Indicators (KPIs) come in. They’re the specific, measurable signposts that tell you whether you’re actually moving toward your business goals.
Let's break down the essential metrics you should be watching, channel by channel.

Think of it as a maturity model. Each level builds on the last, taking you from simply looking at numbers to using them to shape what happens next.
Website Performance Metrics
Your website is the hub of your marketing world. Its performance is non-negotiable. Luckily, a few key metrics can give you a surprisingly clear picture of how well it's doing its job.
- Conversion Rate: This is the big one. It's the percentage of visitors who do what you want them to do, fill out a form, sign up for a trial, buy a product. A low conversion rate is a red flag, pointing to potential problems with your page design, messaging, or the offer itself.
- Bounce Rate: This metric shows you the percentage of people who land on a page and leave without clicking anywhere else. A high bounce rate is often a sign of a mismatch, your content isn't what they were looking for, or the page experience is just plain bad.
Social Media Engagement Metrics
Don't sleep on social. Social media analytics is the single largest slice of the analytics market, making up a massive 37.42% of its size in 2024. This rapid growth means mastering these platforms isn't optional anymore.
Here's what to focus on:
- Engagement Rate: This is your content's resonance score. It’s the total interactions (likes, comments, shares) on a post, divided by your followers or the post's reach. A high engagement rate means your audience is listening.
- Reach: This is the total number of unique people who actually see your content. It’s your brand’s visibility score, showing you the potential size of your audience on any given platform.
Strong social media metrics aren't just about popularity. They reflect a brand's ability to build a genuine community, earn loyalty, and open a direct line of communication with customers.
Email Marketing Effectiveness
Email is still a workhorse in digital marketing. It gives you a direct path to nurture leads and keep customers coming back. But to be effective, you have to be constantly watching and tweaking.
- Open Rate: The percentage of people who opened your email. It’s a decent starting point, but with all the recent privacy changes, it can be a bit of a vanity metric.
- Click-Through Rate (CTR): Now this is a metric with teeth. CTR measures the percentage of recipients who clicked a link in your email. It's a much stronger sign of real engagement because it proves your message was compelling enough to make someone act.
Paid Advertising ROI
When you're spending money on ads, you need to know it's working. A couple of core KPIs are essential for making sure your ad budget is actually turning a profit. For a deeper look, check out our guide on the role of analytics in advertising.
- Cost Per Acquisition (CPA): This is your bottom line for acquiring a new customer. You take the total cost of a campaign and divide it by the number of conversions. It tells you exactly what you paid to get that new customer in the door.
- Return on Ad Spend (ROAS): This metric answers the most important question: "For every dollar I spend, how much revenue am I getting back?" A high ROAS means your campaign is profitable. Simple as that.
Choosing Your Marketing Analytics Tools
Great marketing analytics isn't about having one magic tool; it's about building the right toolkit. Think of it like a carpenter, you can't build a house with just a hammer. You need a mix of tools that gather, connect, and make sense of data from every corner of your strategy.
This collection of tools is what we call a "marketing stack." Don't let the term intimidate you. You can start small with a few core platforms and add more as you grow. To get your analytics strategy off the ground, you need the right tech. You can explore some of the best digital marketing analytics tools to see what fits your current needs and budget.
Foundational Analytics Platforms
Most teams build their stack on a few essential pillars, with each tool playing a distinct role in the data ecosystem.
- Website Analytics: This is your home base for understanding everything that happens on your site. For most, Google Analytics is the starting point, giving you deep insights into where your traffic comes from, how people behave, and what leads to conversions. The first step is always learning how to track visits to a website.
- Customer Relationship Management (CRM): A good CRM is where marketing efforts meet sales outcomes. Platforms like HubSpot or Salesforce are essential for tracking the entire customer journey, storing priceless data on leads, deals, and every interaction along the way.
- Native Social & Ad Platforms: Never underestimate the power of the analytics baked right into platforms like Meta, LinkedIn, and Google Ads. They offer granular, real-time data on campaign performance and audience demographics that third-party tools can't always touch.
The screenshot below from Google Analytics shows a typical dashboard view for monitoring website traffic sources.
It gives you a quick, clear picture of which channels, like Organic Search or Direct traffic, are driving the most users to your site.
Keeping Your Data Clean Across All Your Tools
The real challenge isn't just collecting data, it's making sure that data is clean, accurate, and tells the same story across all your platforms. This is where data integrity becomes non-negotiable. Without it, you're flying blind and making decisions on bad information.
Data integrity is the difference between a precise map and a blurry sketch. One guides you to your destination with confidence, while the other leads to costly wrong turns and missed opportunities.
To keep data quality high, marketers rely on a couple of key tracking mechanisms:
- UTM Parameters: These are simple tags you add to the end of a URL. They act like little breadcrumbs, telling your analytics tools exactly where a visitor came from. This lets you attribute traffic and conversions to specific campaigns, sources, and even individual pieces of content with pinpoint accuracy.
- Tracking Pixels: A pixel is just a tiny snippet of code you place on your website. It acts as a messenger, sending data back to platforms like Meta or Google. This is what enables you to track conversions, build powerful retargeting audiences, and measure the true ROI of your ad spend.
How to Build a Measurement Framework
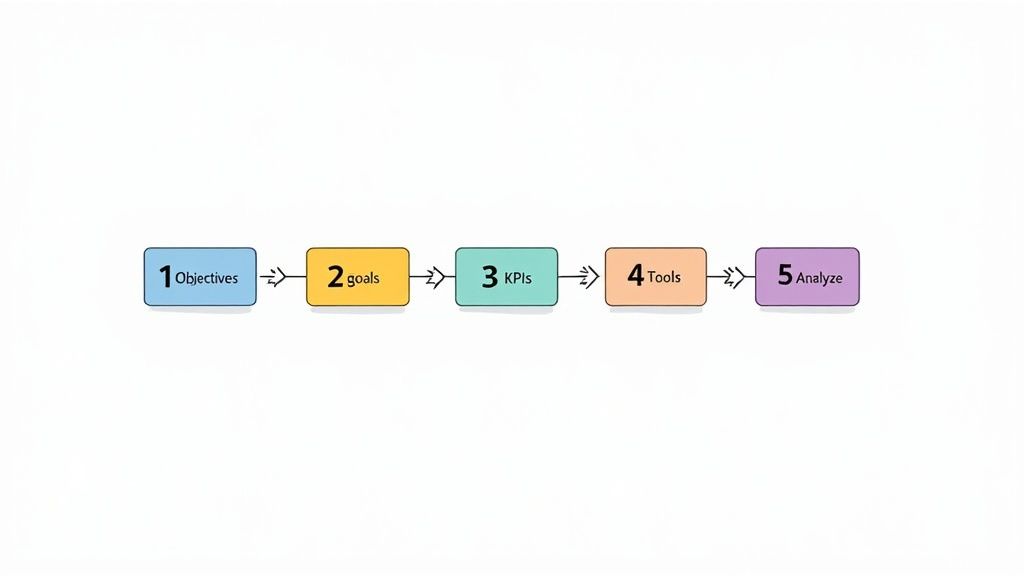
Collecting data is just the starting line. The real magic of marketing analytics is turning a sea of raw numbers into a clear plan that actually moves the needle. Without a structured approach, you’re just swimming in data without ever getting to shore.
A measurement framework is your bridge from data to strategy.
Think of it as the blueprint for your marketing. You wouldn't build a house without one, right? The same goes for your campaigns. A framework ensures every action you take is intentional and laser-focused on your ultimate business goals.
Start with Business Objectives
Before you even think about metrics, you need to zoom way out. What are the high-level business objectives? Forget marketing for a second and put on your CEO hat.
These are the big-picture targets that guide the entire organization. Things like:
- Increase overall company revenue by 20% this year.
- Successfully launch in a new international market.
- Reduce customer churn by 15%.
Everything you build in your framework must trace back to one of these foundational goals. This is non-negotiable. It's how you prove marketing isn't just a cost center, it's a growth engine.
Translate Objectives into Marketing Goals
Okay, now you can put your marketing hat back on. It's time to connect those broad business objectives to specific marketing outcomes. How can your team’s actions directly support the company's north star?
If the business objective is to increase revenue, a marketing goal might be to generate 500 new sales-qualified leads (SQLs) this quarter.
If the objective is to improve retention, a marketing goal could be to increase product feature adoption by 30% among existing users through targeted educational campaigns. See the connection?
A strong measurement framework ensures that every KPI you track has a clear "why" behind it. It moves your team from reactive reporting on vanity metrics to proactively measuring what truly matters for business growth.
This process forces you to focus on activities that create a measurable impact, not just noise.
Identify KPIs and Set Up Your Tools
With clear marketing goals defined, you can finally pick the Key Performance Indicators (KPIs) that will tell you if you're winning or losing. Each goal should have one or two primary KPIs tethered to it.
For a goal of generating SQLs, your main KPI is obvious: the number of SQLs generated. You’d likely support this with secondary metrics like Cost Per SQL to measure efficiency.
Once you know what to measure, you have to make sure your tools are actually set up to capture it. This is the nuts-and-bolts work: setting up conversion tracking in Google Analytics, ensuring your CRM captures lead sources correctly, and being religious about using UTM parameters across all campaigns. This technical setup is crucial for data you can trust.
You can also dig deeper into different measurement strategies by exploring more advanced models for marketing that can sharpen your approach.
Finally, the whole process comes full circle. Use the insights from your analysis to optimize and iterate. Your measurement framework isn't a static document you create once and forget. It's a living, breathing guide that helps you make smarter decisions, refine your strategy, and prove the value of your work.
A Few Common Questions About Marketing Analytics
Even with the best plan, you're going to have questions once you start digging into the data. Here are a few of the most common ones we hear, along with some straight-up answers to help you get moving.
How Do I Start with Analytics on a Small Budget?
Good news: you can get started for $0. The trick is to begin with the powerful free tools you probably already have access to.
- Google Analytics 4 is the gold standard for website data, and it's completely free.
- Native social media analytics, like what you'll find in Meta Business Suite or LinkedIn Analytics, give you a direct line into how your audience is responding to your content.
- Google Looker Studio lets you connect those free data sources and build simple, clean dashboards to track what matters.
Don't try to boil the ocean. Start small. Focus on just a handful of critical metrics, like conversion rates and traffic sources. Once you can show how valuable those initial insights are, it becomes much easier to make the case for investing in more advanced tools.
What Is the Difference Between Marketing Analytics and Business Intelligence?
This is a great question. Think of it like a camera lens.
Marketing analytics is the zoom lens, focusing tightly on marketing performance, campaigns, channels, and ROI. Business Intelligence (BI) is the wide-angle lens, capturing the entire business landscape.
Marketing analytics zeroes in on optimizing marketing efforts. Business Intelligence pulls back to see the whole picture, combining marketing data with inputs from sales, finance, and operations to shape company-wide strategy.
In other words, your marketing analytics are a critical piece of the puzzle that feeds into the larger BI view of your company's overall health.
How Often Should I Check My Marketing Analytics Reports?
The honest answer? It depends entirely on what you're tracking. Checking everything daily is a recipe for getting lost in the noise.
A better approach is to set a rhythm for your reporting:
- Daily: Reserve this for fast-moving, operational metrics that need quick adjustments. Think ad spend or click-through rates on a campaign you just launched.
- Weekly: This is the right cadence for tracking channel performance trends. How's your social media engagement looking? Are email open rates holding steady?
- Monthly or Quarterly: Save this for the big, strategic metrics that guide long-term decisions. Things like Customer Lifetime Value (CLV) and market share don't change overnight, so looking at them over a longer period gives you a much clearer signal.
Ready to enrich your analytics with real-time brand data? Brand.dev instantly provides logos, colors, and company info to personalize user experiences, automate on-brand content creation, and make your product feel custom-built for every customer. Start personalizing with Brand.dev.