So, what exactly is marketing analytics?
Think of it as the engine that powers modern marketing. It’s the practice of measuring, managing, and analyzing marketing performance to figure out what’s actually working. This isn't just about collecting data; it's about turning raw numbers from campaigns into a reliable navigation system that tells you not only what happened, but why.

From Guesswork to Growth Engine
Imagine trying to captain a ship across the ocean without a compass, map, or weather forecast. Sure, you could sail in a general direction, but you’d have no real way to measure progress, dodge storms, or find the quickest route. Marketing without analytics is pretty much the same, a series of hopeful shots in the dark with no clear connection to business results.
Marketing analytics provides those essential navigation tools. It’s the process of taking messy spreadsheets and disconnected data points and weaving them into a clear story. It helps you get inside your customers' heads, see which campaigns are hitting the mark, and find the ones that are just burning cash.
Why Analytics Is Non-Negotiable Today
Not long ago, marketing success was often gauged by gut feelings and fuzzy metrics. Today, every dollar has to be justified with real, tangible results. It's no surprise the global marketing analytics market, recently valued at $5.35 billion, is projected to rocket to $11.53 billion in the next five years. Companies are investing heavily because data simply beats guesswork, every time.
This shift moves your team beyond just reporting on what happened last quarter. It’s about spotting patterns, predicting what’s next, and prescribing the smartest course of action to get ahead of the curve.
To truly get a handle on marketing analytics, it helps to break it down into its core components. These three pillars work together in a continuous loop to drive improvement.
This table provides a quick look at the fundamental pillars of marketing analytics. Think of it as a cheat sheet for the key concepts we'll be diving into throughout this guide.
Core Components of Marketing Analytics at a Glance
| Component | Description | Example |
|---|---|---|
| Measurement | The "what." This is the foundational act of gathering raw data from all your marketing channels. | Tracking website traffic from Google Analytics, counting likes on a social media post, or monitoring email open rates. |
| Analysis | The "why." Here, you dig into the data to interpret it, spot trends, and connect the dots. | Noticing that a specific blog topic drives 25% more sign-ups than others, or that leads from LinkedIn convert at a higher rate. |
| Optimization | The "now what." This is where insight turns into action. You use your analysis to make smart changes. | Reallocating ad spend to the best-performing channel, or A/B testing a new headline on your landing page. |
By mastering these three activities, marketing stops being a cost center and becomes what it should be: a predictable, measurable engine for revenue growth.
Ultimately, marketing analytics is what allows teams to make smarter, faster, and more profitable decisions. It's also the secret to creating truly relevant customer experiences. For instance, when you enrich your customer data with more context, you can dramatically improve personalization, something we cover in our guide to B2B data enrichment.
The Metrics That Actually Matter
Ever feel like you're drowning in data but starved for actual insights? It’s a classic marketing problem. Analytics isn't about tracking every possible number under the sun; it's about zeroing in on the metrics that directly fuel business growth. Likes and shares are nice, but they don't pay the bills.
The real game is identifying Key Performance Indicators (KPIs) that tell the story of your customer's journey and your company's financial health.
To cut through the noise, it helps to group your metrics into a few logical buckets. This simple framework lets you see exactly how different activities contribute to the big picture, from first touch to final sale.
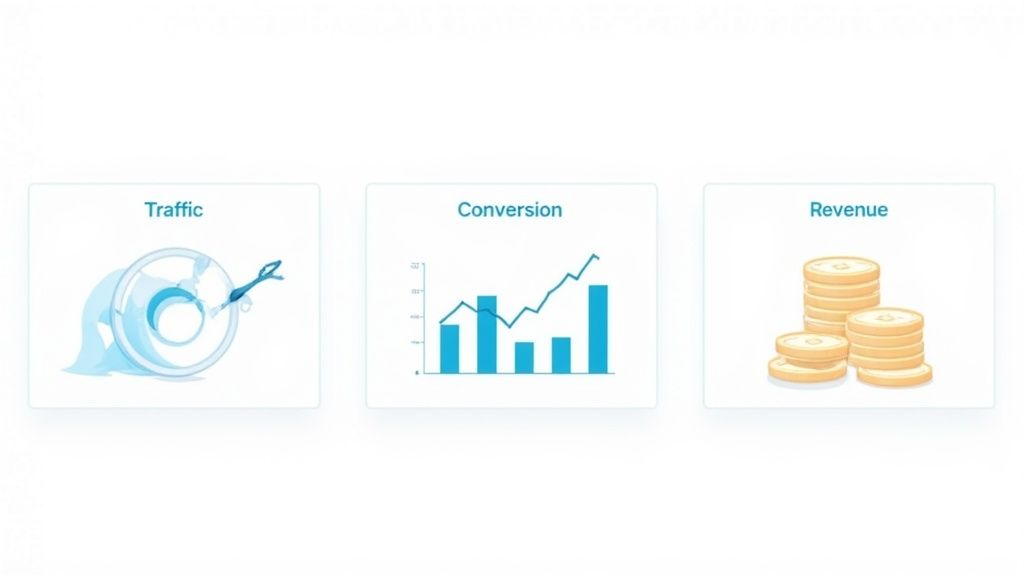
Key Metric Categories
-
Traffic Metrics: This is all about the top of your funnel, how are people discovering you in the first place? These numbers measure your reach and brand visibility. Think Sessions (total visits), Users (unique individuals), and Bounce Rate (the percentage of people who leave after seeing just one page).
-
Conversion Metrics: This bucket tells you how good you are at turning casual visitors into leads or customers. It’s where you measure action. The big ones here are Conversion Rate (the percentage of visitors who complete a goal), Cost Per Acquisition (CPA) (what you pay for a new customer), and your Lead-to-Close Ratio.
-
Revenue Metrics: This is the bottom line. Is your marketing actually making money? These metrics tie every effort directly to financial results. You'll want to obsess over Return on Investment (ROI), Customer Lifetime Value (CLV), and Average Revenue Per User (ARPU).
The most successful teams are relentless about focusing on the essential digital marketing performance metrics that prove business impact, not just vanity. It’s what separates the high-growth teams from those just spinning their wheels.
Beyond What Happened: The Three Levels of Analytics
Once you know what to track, the real fun begins. You can start analyzing that data at different depths. I like to think of marketing analytics as having three levels of sophistication, each answering a more powerful question than the last.
A common mistake is stopping at the first level. The real value comes from progressing through all three stages, turning historical data into a roadmap for future success.
This progression is what takes you from simply reporting on the past to actively shaping the future. It’s the difference between looking in the rearview mirror and having a GPS that predicts traffic and finds you a faster route.
Descriptive Analytics: The "What"
This is analytics at its most fundamental. Descriptive analytics looks at past data to tell you what happened. It's the foundation of every report and dashboard you've ever seen.
- Example: A report showing you had 10,000 website visitors and 200 sign-ups last month. It describes events that occurred without explaining why they happened.
Predictive Analytics: The "Why" and "What's Next"
Here's where things get interesting. Predictive analytics uses historical data, a bit of statistics, and machine learning to forecast what's likely to happen next. It moves beyond reporting to answer the question, "What is likely to happen?"
- Example: Your model, based on past behavior, predicts that visitors from a specific industry are 3x more likely to become paying customers next quarter. Now you know exactly where to focus your ad spend. Understanding these patterns is key to smart advertising, something we cover in our guide on analytics in advertising.
Prescriptive Analytics: The "How"
This is the most advanced stage and the holy grail for data-driven teams. Prescriptive analytics doesn't just predict the future; it recommends specific actions to take to get the outcome you want. It answers the most critical question of all: "What should we do about it?"
- Example: Your platform not only predicts a dip in engagement from a key customer segment but also recommends launching a targeted re-engagement campaign with a specific offer to prevent that churn before it happens.
By moving through these levels, your analytics practice transforms from a simple reporting function into a strategic engine that powers intelligent, proactive growth.
Building Your Marketing Analytics Toolkit
Great metrics are one thing, but you need the right tools to actually collect, analyze, and make sense of all that information. Think of it like assembling the perfect workshop. You need a place to keep your raw materials (your data sources) and a set of powerful instruments (your analytics tools) to shape them into something valuable.
Without both, your data just sits there, scattered, silent, and unable to give you the insights you need. Let’s break down the essential components that form the backbone of a modern analytics stack.
Identifying Your Core Data Sources
Your analytics journey always starts with data collection. Think of these sources as the wells you draw from to understand what’s really happening with your marketing. Every customer interaction, click, and conversion happens somewhere, and your first job is to tap into those streams.
You’ll typically pull from a few key places:
- Website Analytics Platforms: Tools like Google Analytics or Plausible are non-negotiable. They’re the bedrock for understanding on-site behavior, seeing where your traffic comes from, and mapping out user journeys. To get started, you'll need a solid grasp of how to track visits to a website effectively.
- Customer Relationship Management (CRM) Systems: Platforms like Salesforce or HubSpot are absolute goldmines. They store crucial information on leads, prospects, and customers, letting you connect the dots between marketing campaigns and actual sales outcomes.
- Advertising Platforms: Getting data straight from Google Ads, Meta Ads, and LinkedIn Ads is vital for measuring ROI. These platforms tell you exactly what you’re spending and what you’re getting back in terms of impressions, clicks, and conversions.
- Social Media and Email Platforms: Tools like Mailchimp or your social scheduling software provide direct data on audience engagement, open rates, and follower growth.
By pulling data from all these different sources, you start to build a complete, panoramic view of your entire marketing ecosystem.
Choosing the Right Analytics Tools
Once you have your data streams flowing, you need the right machinery to process it all. Marketing analytics tools range from simple, all-in-one solutions to highly specialized platforms. The right choice really depends on your team's size, technical skills, and what you’re trying to achieve.
When it comes to the tools that turn raw data into intelligence, they generally fall into two main camps.
The goal isn’t to find one perfect tool, but to build a “stack” where different platforms work together. Your CRM handles customer data, an analytics platform tracks web behavior, and a BI tool visualizes the combined results.
Understanding the broader landscape here is key. As you build your toolkit, it's worth exploring the various types of business intelligence tools that can take your insights far beyond what marketing-specific platforms can do alone.
Comparison of Marketing Analytics Tool Categories
To make sense of the options, it helps to categorize them by their primary function. Some tools are designed for simplicity and integration, while others offer deep, customizable analysis for teams who need to dig into complex business questions.
Here’s a quick breakdown of the main tool categories:
| Tool Category | Primary Function | Examples |
|---|---|---|
| All-in-One Platforms | Combines marketing automation, CRM, and analytics in a single, unified suite. | HubSpot, Marketo |
| Website Analytics | Tracks on-site user behavior, traffic sources, and conversion funnels. | Google Analytics, Plausible, Fathom |
| Specialized BI Tools | Aggregates data from many sources to create custom, in-depth visualizations. | Tableau, Looker Studio, Power BI |
| Product Analytics | Focuses on in-app user behavior to understand feature adoption and retention. | Mixpanel, Amplitude |
| Data Warehouses | Central repositories for storing massive amounts of structured and raw data. | BigQuery, Snowflake, Redshift |
For many growing companies, the path starts with an all-in-one solution for its ease of use. As data needs become more complex, they often layer a specialized BI tool on top for deeper, more customized analysis. This hybrid approach often provides the best of both worlds, enabling both day-to-day campaign tracking and high-level strategic planning.
Putting Your Analytics Strategy Into Action
Having a powerful analytics toolkit is a great start, but tools alone don't build a business. An analytics strategy is just a document until you actually put it into practice. This is where you move from theory to execution, building a clear, step-by-step roadmap that connects your data directly to your business goals. It's time to build the operational muscle to turn insights into measurable growth.
The whole process kicks off with a solid foundation. You can’t measure what you haven’t defined. Before you even think about pixels or dashboards, you need a crystal-clear measurement plan. This plan is your north star, making sure every piece of data you collect serves a specific, strategic purpose. It forces you to ask the most important question first: "What business outcome are we really trying to achieve?"
From Business Goals to Tangible KPIs
The first step, and honestly, the most critical one, is translating those high-level business objectives into specific, trackable Key Performance Indicators (KPIs). Get this right, and you'll ensure your marketing efforts are perfectly aligned with what leadership and the rest of the company actually care about.
Think of it as a simple hierarchy:
- Start with the Business Goal: This is the big picture, like "Increase market share in the fintech sector."
- Define a Marketing Objective: This is your team's contribution to that goal. Something more specific, like "Generate more qualified leads from fintech companies."
- Identify Key Performance Indicators (KPIs): These are the concrete metrics you'll live and die by. For example: Marketing Qualified Leads (MQLs) from the fintech segment, Cost Per MQL, and the MQL-to-SQL Conversion Rate.
This straightforward structure stops you from getting distracted by vanity metrics. It keeps your team laser-focused on activities that drive real results and ensures every report tells a story that matters to the bottom line.
Implementing Your Tracking Mechanisms
With your KPIs defined, it's time to get tactical. You need to set up the technical plumbing to capture the right data at the right time. This is where you connect the dots between user actions and your analytics system, and accuracy is everything.
A few key components you'll need to get right:
- Tracking Pixels and Tags: These are the tiny snippets of code from platforms like Google, Meta, or LinkedIn that you place on your website. They monitor user actions like page views, form submissions, and purchases.
- UTM Parameters: Think of these as little tracking labels you add to your URLs. They tell your analytics tools exactly where a visitor came from, the source, medium, and campaign, which is absolutely vital for accurate attribution.
Pro Tip: Consistency here is non-negotiable. Create a standardized naming convention for your UTM parameters and make sure the entire team follows it. Inconsistent tagging (e.g., "linkedin," "LinkedIn," and "li") creates a messy, fragmented dataset that's nearly impossible to analyze correctly.
When this is implemented properly, you can trace a new lead in your CRM all the way back to the exact ad, email, or social post that brought them to you.
This flow chart breaks down how a modern analytics stack turns raw information from all over the place into actionable intelligence for your team.
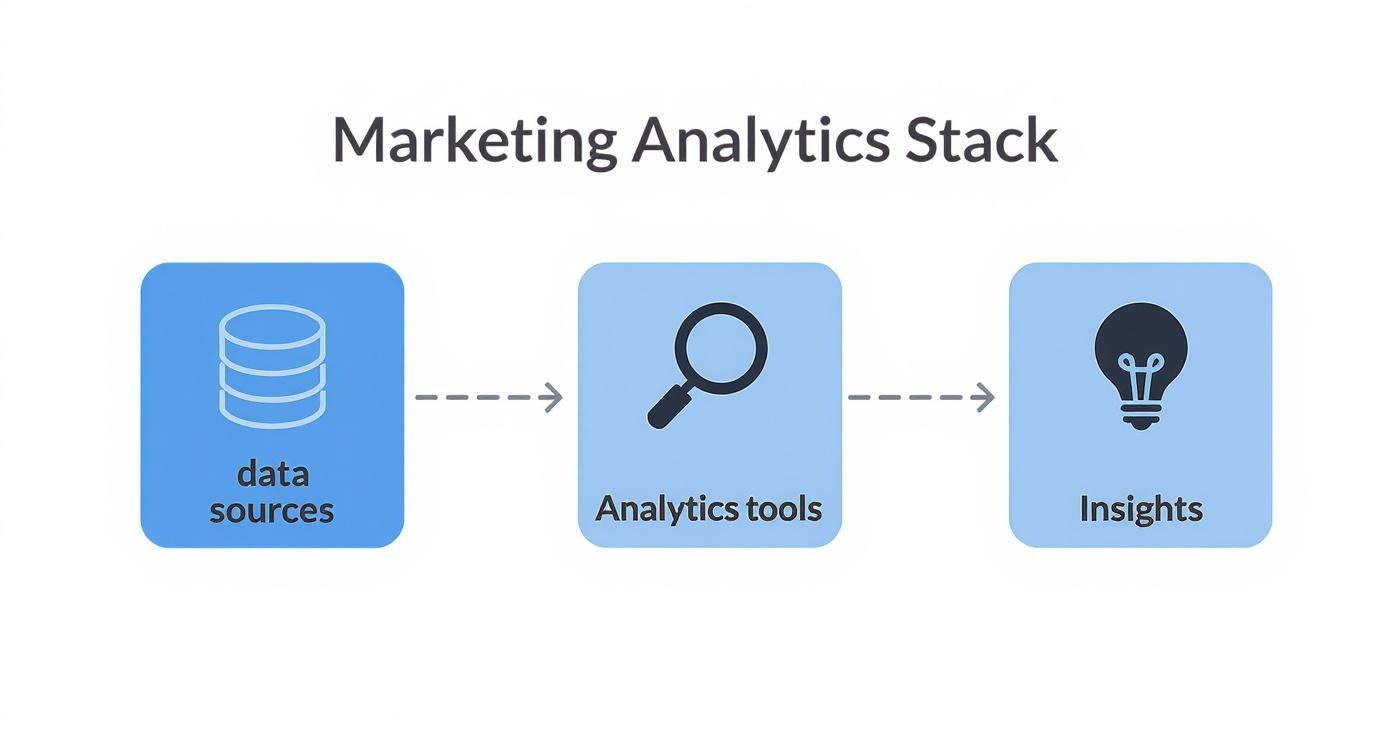
As you can see, it's a clear progression from data collection to insight generation, the very heart of any successful implementation.
Ensuring Data Governance and Quality
Finally, no analytics strategy can survive on a foundation of messy, unreliable data. This is where data governance comes in. It’s the set of processes, rules, and standards that ensure your data is clean, consistent, and trustworthy. Think of it as quality control for your most valuable asset.
And it’s more important than ever. Surveys show that nearly 87% of marketers see data as their company's most underutilized asset. It’s no surprise, then, that around 40% of brands are increasing their budgets for data-driven marketing to close that gap. You can dig into more details in this analysis of marketing analytics trends.
Effective data governance isn't complicated. It boils down to:
- Data Cleaning: Routinely removing duplicates, correcting errors, and standardizing formats.
- Access Control: Defining who can view, edit, and use specific datasets to prevent accidental corruption.
- Documentation: Keeping a clear record of your data sources, definitions, and any transformations you apply.
Without strong governance, you’re flying blind and risk making critical business decisions based on flawed information. By creating a smart measurement plan, implementing robust tracking, and obsessing over data quality, you build a reliable analytics engine that’s truly ready to power your company’s growth.
How Top Companies Win with Analytics
Alright, let's move from theory to reality. It's one thing to talk about concepts, but it's another to see how sharp companies actually put marketing analytics to work to solve thorny business problems and drive real growth. These aren't just abstract ideas, they're battle-tested tactics that create a serious competitive edge.
Across fast-growing SaaS platforms, established fintech firms, and AI startups, analytics is the engine room. It’s what informs strategy, tells you where your money is really going, and ultimately helps you build a better customer experience. Let's dig into a few specific examples that show how this works.
Slashing Churn with Cohort Analysis
Imagine a SaaS company struggling with a leaky bucket. They're great at acquiring new users, but a huge chunk of them vanish within the first three months. Instead of throwing spaghetti at the wall to see what sticks, they turn to cohort analysis, grouping users by the month they signed up.
By watching each group's behavior over time, they spot a massive pattern: users who don't engage with a specific feature, "Project Templates," within their first week are 80% more likely to churn. Suddenly, the problem isn't so vague anymore. The insight is crystal clear.
- Action Taken: They completely overhauled their onboarding to steer new users directly toward the "Project Templates" feature right after they sign up.
- Result: Within just two quarters, churn among new users plummeted by over 35%. That's a huge lift in customer lifetime value.
This is a perfect example of analytics turning a fuzzy problem ("high churn") into a specific, actionable insight that goes straight to the bottom line.
Predictive Lead Scoring in Fintech
Over in the B2B world, a fintech firm is drowning in leads, thousands per month. The sales team is totally overwhelmed, wasting precious hours chasing prospects who will never convert while the truly hot leads go cold. The solution? A predictive lead scoring model.
This model crunches historical data from thousands of past leads, figuring out the exact attributes and behaviors that correlate with a closed-won deal. It might be company size, industry, the specific pages they browsed on the website, or a whitepaper they downloaded.
By assigning a score to each new lead based on their likelihood to convert, the model allows the sales team to focus exclusively on the hottest prospects first, transforming their efficiency and effectiveness.
This simple shift ensures that high-value opportunities get immediate attention, which shortens the sales cycle and maximizes the team's impact. No more guesswork.
Justifying R&D Spend with Attribution Modeling
Now picture an innovative AI startup. They're pouring money into high-quality thought leadership, webinars, deep-dive research reports, and technical blog posts, to build credibility. The marketing team swears this content is influencing major deals, but the C-suite just sees a line item on the budget with no clear ROI. To bridge that gap, they implement a multi-touch attribution model.
Instead of giving 100% of the credit to the last click (like a "Request a Demo" form fill), this model spreads the credit across all the different touchpoints a lead had along their journey. The analysis told a powerful story: while the demo request gets the final click, over 60% of enterprise customers who eventually signed six-figure contracts first engaged with a technical webinar or downloaded a research report.
That data was the proof they needed. The early-stage content wasn't just a cost center, it was a critical investment that nurtured and qualified the company's most valuable customers. The marketing team now had the hard evidence to not only justify but expand its content budget.
Supercharging B2B Personalization with Brand Data
One of the biggest unlocks in modern marketing analytics is enriching your internal data with external context. This is an absolute game-changer for B2B account-based marketing (ABM).
Imagine a growth team targeting a list of 500 high-value accounts. Instead of blasting out generic outreach, they use a brand API to automatically enrich their CRM data.
For each company on their list, they can instantly pull in:
- The company's official logo and color palette.
- Their industry and a concise company description.
- The correct typography and style guidelines.
This enriched data fuels powerful, dynamic personalization at scale. Think targeted ads where the creative automatically features the prospect's own logo, or landing pages that dynamically adjust their color scheme to match the visitor's brand. This deep level of personalization makes prospects feel seen and understood, which dramatically boosts engagement.
It’s strategies like this that are fueling the analytics boom, especially in North America. The region's digital marketing analytics market was recently valued at $1.807 billion and is projected to grow at an impressive 19.1% CAGR, driven by the adoption of advanced tech. You can dive deeper into this growth in this detailed research from Verified Market Research.
What's Next for Marketing Analytics?
The world of marketing analytics isn't just evolving; it's accelerating. As we look ahead, the entire practice is being reshaped by some massive shifts in technology and a much-needed focus on consumer privacy. Staying on top of these trends is the only way to build a strategy that’s resilient enough for tomorrow. The future isn't about hoarding more data, but about using it smarter, faster, and more responsibly.
This evolution is really happening on three major fronts. Each one is set to completely redefine what analytics tools can do and what skills marketers will need to stay competitive.
AI and Predictive Modeling Are Taking Over
Artificial intelligence and machine learning are no longer just buzzwords on the fringe; they're moving straight to the core of marketing analytics. Instead of just looking in the rearview mirror to see what happened, AI-powered systems can now predict future outcomes with almost startling accuracy. This is a huge leap from basic forecasting to proactive, automated decision-making.
Just imagine models that don't just flag at-risk customers but also recommend the exact retention offer most likely to keep them. Or an AI that dynamically shifts your ad budget in real-time to the channels lighting up with the highest conversion potential. This turns analytics from a reactive reporting tool into a proactive, strategic partner that’s always one step ahead.
The Unrelenting Demand for Real-Time Insights
The days of patiently waiting for weekly or monthly reports are long gone. The modern customer journey happens in a series of fleeting moments, and your decisions have to be made just as quickly. The future of analytics is happening in real-time, crunching data as it flows in to give you immediate insights.
A delay in data is a delay in opportunity. Real-time processing allows marketers to react instantly to a surge in traffic, a dip in campaign performance, or a competitor's move, closing the gap between insight and action.
This isn't a "nice-to-have" anymore. This capability is absolutely essential for everything from dynamic ad personalization to instant fraud detection, making your entire marketing engine more agile and responsive than ever before.
Navigating a Privacy-First World
This might be the biggest shake-up of all: the pivot to privacy-centric analytics. With third-party cookies being phased out and regulations like GDPR and CCPA setting new standards, the old playbook for tracking users is officially obsolete.
A future-proof analytics strategy will have to lean heavily on:
- First-party data: Information your customers willingly and directly share with you.
- Anonymized data modeling: Using clever statistical techniques to spot trends without ever compromising individual privacy.
- Consent management platforms: Tools that put users firmly in control of how their data is collected and used.
This new reality forces a fundamental shift away from tracking everyone to deeply understanding the customers you have a direct, trusted relationship with. It’s a change that demands transparency but ultimately rewards that trust with stronger, more sustainable connections.
Got Questions? We've Got Answers.
Even with a great plan, a few questions always pop up. Here are some quick, no-nonsense answers to the common ones we hear from teams putting their data to work.
Marketing Analytics vs. Web Analytics: What's the Difference?
It’s easy to get these two mixed up, but the distinction is pretty simple. Think of web analytics as one important chapter in the much larger book of marketing analytics.
-
Web Analytics is laser-focused on what happens on your website. It’s all about page views, bounce rates, session duration, the stuff that tells you how people are interacting with your site.
-
Marketing Analytics pulls the camera back to see the whole picture. It stitches together data from your website, CRM, social media, ad platforms, and email campaigns to measure how your entire marketing strategy is performing and, most importantly, how it's driving revenue.
So, web analytics shows you how people use your site. Marketing analytics tells you if all your marketing efforts, combined, are actually working.
How Can Small Businesses Get Started on a Tiny Budget?
You absolutely don't need an enterprise-sized budget to do this right. Small businesses can get surprisingly far by being scrappy and focusing on a few powerful, free tools.
- Start with Google Analytics: It’s free, it’s powerful, and it gives you all the foundational website data you’ll ever need to get started.
- Use Your CRM’s Brain: Most CRMs come with built-in reporting. Use it! This is your bridge for connecting marketing campaigns directly to leads and sales.
- Master UTMs: This is non-negotiable and completely free. Using UTM parameters consistently is the secret to getting crystal-clear data on where your traffic and leads are coming from.
- Pick One Big Goal: Don't try to boil the ocean. Choose one primary objective, like generating demo requests, and track only the few key metrics that directly influence that outcome.
What Are the Biggest Mistakes to Avoid?
The most common traps in marketing analytics are rarely technical, they're almost always strategic. Getting this right means sidestepping a few classic blunders.
One of the biggest missteps is chasing vanity metrics. Things like social media followers feel good, but they don't pay the bills. While nearly one in five marketers name ROI their top metric, only 34% actually track it consistently because their tools are a disconnected mess.
Other critical mistakes include:
- Garbage In, Garbage Out: Working with messy, untagged data will only lead you to the wrong conclusions, fast.
- Ignoring the "Why": Just reporting what happened isn't enough. The real value comes from digging in to understand why it happened.
- Buying Tools Before Strategy: Don't fall for shiny object syndrome. A complex, expensive tool is useless without a clear plan for what you need it to do.
Ready to supercharge your personalization and enrichment efforts? Brand.dev provides the Brand API that lets you instantly integrate logos, colors, and complete company profiles into your product. Start building for free.